Chief Financial Officer's performance review

Management reacted quickly to the further deterioration in the macro and consumer environment during FY24, taking decisive tactical decisions to protect profits and cash flows while delivering against the group's long-term strategic priorities
Tim Jacobs
Group Chief Financial Officer
With Showmax, SuperSportBet and Moment all now generating revenues following successful launches during FY24, the group is well positioned to grow in its target segments, while supporting the core linear broadcasting business through a challenging point in the macro cycle
3%
Organic revenue growth underpinned by inflation-led pricing
26.2%
South Africa trading margin of 26.2%, within mid-twenties target range
Strong financial momentum in DStv Insurance, DStv Internet and DStv Stream
ZAR3.4bn
ZAR1.9bn in cost savings, and ZAR1.5bn YoY in additional reduction in decoder subsidies1
Up 48% YoY
Rest of Africa maintained positive trading profit at ZAR1.3bn
ZAR1.375bn
South African cash flows support maintaining the Phuthuma Nathi dividend
24% YoY
Organic trading profit growth
Up 22% YoY
Successful launch of the new Showmax platform with revenues up 22% YoY
ZAR11.4bn
Available liquidity of ZAR11.4bn (ZAR7.3bn in cash plus ZAR4.1bn in available facilities)
- 1 ZAR1.9bn in cost savings includes ZAR0.7bn in savings on decoder costs, with the further reduction in decoder subsidy driven by increased device pricing and unbundled acquisition offers
Operational performance review
"The group implemented average price increases of 5.6% in ZAR in South Africa and 27% in local currencies in our Rest of Africa markets during FY24 in order to offset the impact of foreign exchange headwinds on revenues"
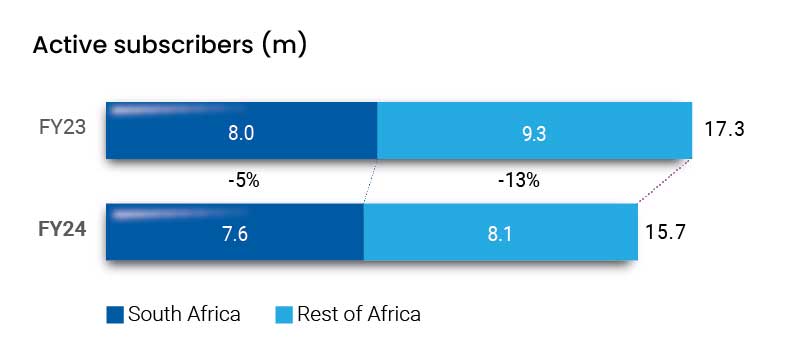
Subscriber growth is typically more muted in a year that follows the FIFA World Cup, but FY24 came in below trend as the subscriber base declined YoY in the face of severe macro and consumer pressures. Despite the typical resilience of pay-TV in a downturn, many of our would-be customers could not afford to consistently pay for our product or chose not to subscribe when power availability was unreliable in markets like South Africa.
The group has largely focused on its 90-day subscriber metric since listing in order to provide shareholders and market observers with a subscriber metric that looks through the monthly volatility in the subscriber base. However, management is increasingly managing the business on the basis of active subscribers to optimise retention and activity rates from month-to-month in a low growth environment. As a result, the group is focusing and commenting on active subscribers rather than 90-day active subscribers, but will continue to disclose both metrics for continuity.
The group’s active subscriber base declined by 9% YoY, with the base split between 8.1m households (52%) in Rest of Africa and 7.6m households (48%) in South Africa at year-end.
The Rest of Africa business saw a 13% YoY decline in active subscribers as mass-market customers in countries like Nigeria had to prioritise basic necessities over entertainment. The group’s inflation-led pricing discipline and tactical decision to reduce decoder subsidies in a weak growth environment placed some incremental pressure on the rate of bringing new customers into the base but was critically important in protecting the segment’s profits and cash burn.
The South African business showed more resilience with a 5% decline in subscribers despite a consumer under financial distress due to the sharp rise in the cost of living from inflation and interest rates. The impact of persistent loadshedding through FY24 also created an environment where customers without backup power were frequently reluctant to reconnect.
The group’s online user base has seen promising growth. DStv Stream delivered 3x YoY growth in subscribers following its rebranding and relaunch in FY24, with activity boosted by popular sports events such as the Rugby World Cup, and the group also debuted Extra Stream in August 2023 to provide additional viewing environments on mobile devices. Showmax, which re-launched in early February 2024, is showing encouraging early traction – it delivered record single-month growth in March 2024 – with the paying subscriber base growing 16% from the migrated base at relaunch to year-end.
Review of financial performance
The group reduced its cost base by ZAR3.4bn during FY24 through cost savings and lower subsidy spend in order to offset a ZAR4.5bn foreign exchange impact on trading profit
| FY22 (ZAR’bn) |
FY23 (ZAR’bn) |
FY24 ZAR'bn |
Organic growth FY23 % |
Organic growth FY24 % |
Notes | |
|---|---|---|---|---|---|---|
| Revenue1 | 55.1 | 59.1 | 56.0 | 4 | 3 | 1 |
| Costs | (44.7) | (49.1) | (48.1) | 3 | (1) | 2 |
| Trading profit | 10.3 | 10.0 | 7.9 | 5 | 24 | 3 |
| Net interest paid | (1.0) | (1.0) | (1.4) | 4 | ||
| Other losses | (0.2) | (1.0) | (1.1) | 5 | ||
| Taxation | (4.2) | (3.8) | (3.4) | 6 | ||
| Non-controlling interest | (1.5) | (0.6) | 0.2 | 7 | ||
| Core headline earnings | 3.5 | 3.5 | 2.2 | 2 | (38) | 8 |
| Core headline earnings per share | 814 | 828 | 515 | 2 | (38) | 8 |
| Adjusted core headline earnings2 | 1.7 | 1.3 | (20) | 8 | ||
| Adjusted core headline earningsper share2 | 388 | 313 | (19) | 8 | ||
| Trading profit margin | 19% | 17% | 14% | 3 | ||
| Effective tax rate | 59% | 417% | n.m | 6 |
- 1 FY23 and FY22 revenue includes ZAR76m and ZAR163m in losses respectively related to fair-value movements on Nigeria futures contracts. There is no fair-value gain or loss movement in FY24 as all futures contracts have matured.
- 2 Adjusted core headline earnings was introduced in FY24, with comparatives included for FY23, to include losses on cash remittances from Nigeria.
- Reported revenues were down 5% YoY to ZAR56.0bn on the back of foreign exchange pressures, while group organic revenue growth reduced from 4% in FY23 to 3% in FY24 on the back of lower subscriber volumes and activity offsetting stronger local-currency pricing. A 3% decline in South African subscription revenues was partially offset by 35% growth in insurance premiums and higher sub-licensing revenues primarily from the Rugby and Cricket World Cups. Rest of Africa subscription revenues were up 10% organically through inflationary pricing (-12% reported). Advertising revenue grew 3% on an organic basis (-7% reported) as DStv Media Sales leveraged sports events, initiatives to attract small and medium enterprises, digital and OTT advertising and growth in the Rest of Africa local currency business to offset ad market and audience pressures from macro and loadshedding impacts in South Africa. Irdeto grew 7% organically (+17% reported) due to contract wins in external media (notably managed services) and from encouraging momentum in connected transport.
- Operating leverage on an organic basis remained positive in FY24, supported by accelerated cost reduction. Overall costs decreased 1% YoY on an organic basis, despite the increased investment in Showmax, as the group delivered ZAR1.9bn in cost savings, well ahead of our initial target of ZAR0.8bn and our increased target of ZAR1.0bn communicated at the half year. Over and above decoder cost savings of ZAR0.7bn included in the total cost savings figure for FY24, subsidy spend was reduced by a further ZAR1.5bn YoY through increased device pricing and unbundled acquisition offers (excluding the impact of the FIFA World Cup spend in the prior year, subsidy spend reduced by ZAR0.7bn YoY).
- Trading profit on a reported basis decreased by 21% to ZAR7.9bn on the back of foreign exchange losses of ZAR4.5bn, weaker South African trading conditions and the investment in the Showmax relaunch. However, trading profit was up 24% YoY on an organic basis due to the group’s accelerated cost savings drive. Group trading margin declined from 17% to 14%. The Rest of Africa business maintained profitability despite a material foreign exchange impact, generating a trading profit of ZAR1.3bn up 48% YoY. The group delivered South Africa trading margins in its mid-twenties target range at 26.2%.
- Net interest paid increased YoY as the first tranche of the group’s term loan (ZAR8.0bn) was drawn down for the first full year in FY24 and the second tranche (ZAR4.0bn) was drawn down in 2H FY24.
- Other losses increased due to a 23% YoY increase in share of equity-accounted losses during the year as KingMakers net losses increased on the back of losses on cash remittances from Nigeria and the Moment’s net losses grew YoY on the back of its formal launch in FY24.
- The group’s tax expense reduced YoY due to lower profitability in South Africa and the conclusion of the outstanding tax matter with the Nigerian tax authority. The group’s FY24 effective tax rate is not meaningful to assess from a numerical perspective but, for directional context, was negative in the current year due to the group incurring taxes in the profitable South African, Irdeto and Rest of Africa segments, while being in a net loss before tax position due to the impact of the impairment of the Technology Modernisation programme of ZAR1.2bn, ZAR0.4bn higher net interest expense due to the group’s fully drawn-down term loan, ZAR4.6bn in foreign exchange losses on the translation of non-quasi inter-group loans due to the depreciation of the Naira against the USD, and losses on cash remittances from Nigeria (ZAR1.1bn).
- Non-controlling interests decreased YoY due to lower profitability in South Africa, the conclusion of the Showmax partnership with Comcast, with Comcast sharing in 30% of the losses in Showmax, and lower profitability in MultiChoice Nigeria due to the impact of the weaker naira.
- Core headline earnings decreased 38% YoY to ZAR2.2bn due to the decrease in reported trading profit, with some offset from an increase in realised hedging gains in FY24. Adjusted core headline earnings, which is the board’s preferred measure of sustainable business performance going forward as it includes losses on cash remittances, declined by 20% YoY due to the factors noted above, with an additional offset from a narrower gap between the official and parallel naira rates in Nigeria in FY24 relative to FY23.
Review of cash generation
Free cash flow of ZAR0.6bn was down 79% YoY, mainly due to the macro pressures on profitability, the opex and platform investment in Showmax and the ongoing working capital investment in new local content.
| FY22 (ZAR’bn) |
FY23 (ZAR’bn) |
FY24 ZAR'bn |
Organic growth FY23 % |
Organic growth FY24 % |
Notes | |
|---|---|---|---|---|---|---|
| Trading profit | 10.3 | 10.0 | 7.9 | |||
| Non-cash adjustments | 3.4 | 3.1 | 2.7 | 1 | ||
| Working capital investment | (1.0) | (3.1) | (2.5) | 2 | ||
| Cash from operations | 12.7 | 10.0 | 8.1 | (21%) | (19%) | |
| Capital expenditure | (1.1) | (1.2) | (1.2) | 3 | ||
| Lease repayments | (2.5) | (2.5) | (2.7) | 5 | ||
| Investment income | - | - | 0.0 | 6 | ||
| Taxation paid | (3.6) | (3.4) | (3.7) | 4 | ||
| Free cash flow | 5.5 | 2.9 | 0.6 | (47%) | (79%) | |
| Less: Net interest paid | 0.0 | (0.2) | (0.7) | 5 | ||
| Less: Dividends paid by holding company | (2.4) | (2.4) | - | 6 | ||
| Less: PN and other NCI dividends | (1.5) | (1.5) | (1.4) | 6 | ||
| Less: Share buy-backs | (0.3) | - | (0.5) | 7 | ||
| Less: Settlement of share-based compensation awards | (0.1) | (0.2) | (0.1) | 7 | ||
| Add: Proceeds/(Repayment) from long and short-term loans raised | 2.6 | 4.4 | 3.6 | 8 | ||
| Less: Investments in associates | (4.2) | (0.2) | (0.2) | 9 | ||
| Less: Settlement of contingent consideration | (0.5) | - | - | |||
| Less: Other cash movements | (0.2) | (0.1) | 1.2 | 10 | ||
| Retained free cash flow | (1.0) | 2.7 | 2.6 | |||
| Add: Decrease/(Increase) in restricted cash | 0.2 | 0.2 | - | |||
| Deduce: Cash and cash equivalents classified as held-as-sale | - | - | (0.3) | |||
| Foreign exchange translation of foreign cash balances | (1.6) | (1.5) | (2.6) | 11 | ||
| (Decrease)/lncrease in cash and cash equivalents | (2.4) | 1.4 | (0.3) |
- Non-cash adjustments include depreciation and amortisation, impairments or reversals of impairments of tangible and intangible assets, net realisable value adjustments on inventory and non-cash hedge accounting movements. Additional detail is disclosed in the group’s annual financial statements, with depreciation and amortisation of ZAR2.8bn in FY24 the largest single contributor to the net non-cash adjustment.
- Working capital investment remained elevated in FY24 due to the platform technology advances for the Peacock platform (ZAR1.7bn) used by Showmax and higher stock holdings driven by a decrease in decoder sales volumes following the group’s tactical reduction in subsidies resulting in higher selling prices. These movements were partially offset by lower prepayments on decoders and the utilisation of tax security deposits made in prior years following settlement of outstanding tax matters with the Nigerian Federal Inland Revenue Service (FIRS).
- Capital expenditure of ZAR1.2bn was in line with the group’s typical operating range of between ZAR1.0bn and ZAR1.5bn and included higher spend on Technology modernisation project to complete immediately viable modules and on DStv Stream technology stack to support the SA OTT ambitions.
- The group paid direct cash taxes of ZAR3.7bn in FY24, slightly higher than the prior year despite lower group profitability primarily due to a higher top-up payment required in South Africa relating to FY23.
- Net interest paid increased due to the group’s higher average debt position through FY24, partially offset by additional interest received on higher average bank balances during the year.
- There was no group dividend paid in FY24 (FY23: ZAR2.4bn) while dividends to Phuthuma Nathi amounted to ZAR1.4bn for the FY24 and FY23 financial years.
- The group acquired treasury shares to fund future RSU share awards to the value of ZAR0.5bn during FY24, with no acquisitions made in the prior year.
- Net proceeds from short- and long-term loans related to the remaining ZAR4bn drawdown on the ZAR12bn term loan facility raised in FY23 to be used for working capital purposes. The group settled the final outstanding amount of ZAR0.4bn on the pre-existing working capital term-loan facilities in the current year.
- During FY24, the group contributed to Moment’s Seed+ funding round with a USD8m (ZAR151m) investment, increasing our shareholding to 29.6% on a fully diluted basis at year-end at a post money valuation of USD82m.
- The translation of foreign cash reserves includes losses of ZAR1.1bn (FY23: ZAR2.4bn) incurred in Nigeria due to differences between the official rate used by the group for translation of results and the parallel rate at which cash has been remitted. This has been partially offset by an increase at year-end in the ZAR equivalent value of cash held in USD.
Review of financial position
The group had a negative equity position on its balance sheet at year-end, largely driven by a number of non-cash, accounting-driven adjustments impacting negatively on the group’s reserves (see note 5 for further context). Despite these impacts, the group remains liquid and had distributable reserves of ZAR16.2bn, cash of ZAR7.3bn, and undrawn borrowing facilities of ZAR4.1bn at year-end. The group will continue to support the Phuthuma Nathi dividend and invest behind Showmax, but has taken the decision to stop its other major technology projects in order to protect the group’s cash resources in the current environment.
| FY22 (ZAR’bn) |
FY23 (ZAR’bn) |
FY24 (ZAR'bn) |
FY23 growth % |
FY24 growth (%) |
Notes | |
|---|---|---|---|---|---|---|
| Non-current assets | 25.6 | 24.6 | 22.7 | (4) | (8) | 1 |
| Current assets | 17.3 | 23.0 | 21.2 | 33 | (8) | 2 |
| Total assets | 42.9 | 47.6 | 43.9 | 11 | (8) | |
| Non-current liabilities | 13.9 | 19.6 | 24.3 | 41 | (24) | 3 |
| Current liabilities | 20.9 | 22.7 | 20.7 | 9 | (9) | 4 |
| Total liabilities | 34.8 | 42.3 | 44.9 | 22 | 6 | |
| Retained earnings | 24.7 | 18.9 | 16.2 | |||
| Other reserves and non-controlling interests | (16.6) | (13.5) | (17.2) | |||
| Equity | 8.1 | 5.3 | (1.1) | 35 | (120) | 5 |
| Key ratios | ||||||
| Liquidity (current ratio) (times) | 0.8 | (1.0) | 1.0 | 6 | ||
| Leverage (including leases) (times) | 0.77 | 1.08 | 1.53 | 7 | ||
| Interest cover (times) | 14.4 | 12.8 | 8.0 | 7 | ||
| Return on capital employed (%) | 45 | 43 | 33 | 8 |
- Non-current assets were lower YoY, largely due to the ZAR1.2bn impairment of software relating to the discontinued Technology Modernisation programme. The reduction from depreciation and amortisation was broadly offset by capital expenditure and advances on platform technology of ZAR1.5bn relating to Showmax in non-current assets (ZAR1.7bn in total).
- The YoY decrease in current assets was driven by the utilisation of the Nigeria tax security deposits (ZAR1.1bn) following the settlement of the Nigerian tax matters, lower prepayments for software licenses and inventory and the decline in derivative financial instruments with forward exchange contracts maturing in the year (ZAR1.2bn) and the duration of the overall hedge book running down due to the prohibitive cost of forward cover.
- Non-current liabilities increased 24% in the current year due to the ZAR4.0bn increase in the group’s term loan facility, together with the recognition of the liability for the fair value of Comcast’s put option over its 30% shareholding in Showmax of ZAR2.7bn (exercisable seven years after the launch of Showmax on the Peacock platform given the initial contractual platform licensing term). This was partially offset by the net ZAR1.6bn decrease in the non-current lease liabilities of the group through ongoing lease payments.
- Current liabilities declined YoY due to a ZAR0.7bn reduction in accrued expenses from the settlement during FY24 of accruals relating to the preparation of the new Showmax platform, the settlement of FY23 FIFA World Cup related stock liabilities and lower stock orders in the current year due to lower planned sales volumes. Tax liabilities were ZAR0.9bn lower on the back of the reversal of VAT related accruals previously raised in the Rest of Africa segment, deferred income was ZAR0.6bn lower due to a YoY reduction in the closing subscriber base, and short-term loans reduced by ZAR0.4bn to zero with the settlement of the existing working capital term-loan facilities in the current year.
- The group incurred a number of non-cash charges during the year including ZAR4.6bn in losses on the translation of non-quasi inter-group loans between MultiChoice Africa Holdings B.V. and MultiChoice Nigeria Limited, a ZAR1.2bn impairment charge on the group’s Technology Modernisation programme, and the recognition of the ZAR2.7bn estimated fair value of the Comcast put option relating to its 30% shareholding in Showmax. This has left the group with a negative equity balance of ZAR1.1bn at year-end, but has no impact on the liquidity and going concern of the group
- Measured as current assets divided by current liabilities. The current ratio remained stable in the current year at ~1.0x, with the group’s healthy cash balance, available undrawn facilities and low leverage ratio providing management with comfort over the group’s liquidity position.
- Leverage is measured as net debt (lease liabilities plus term loan less cash) divided by earnings before interest, taxation, depreciation and amortisation (EBITDA). Leverage remains at an acceptable level at 1.53x at the end of FY24 (FY23: 1.08x). This provides adequate financial headroom for the group given a debt covenant cap of 2.5x. Interest cover is measured as EBITDA divided by net interest paid, and reduced from 12.8x in FY23 to 8.0x in FY24 due to lower profitability and a ZAR0.4bn increase in net interest paid. It remains well above covenant and treasury policy limits of 4.0x.
- Measured as trading profit divided by capital employed (defined as average total assets less average current liabilities). Return on capital employed declined from 43% in FY23 to 33% in FY24 due to a 21% fall in trading profit on a comparatively stable operating asset base as capital employed increased by 2% YoY.
Technology Modernisation programme
Since FY20, the Group has been investing in a multi-year Technology Modernisation (Tech Mod) programme aimed at upgrading the Group's digital, customer, billing, payments, partnerships and data capabilities. To date, it has successfully developed and implemented four of the six core Tech Mod modules, being an Automated Digital Marketing module to support improved customer value management journeys and automated campaigns, a business Partnership module, DStv for Business module and a Field Sales and Services module to support improved customer experience and data collection in Rest of Africa.
The Tech Mod programme as a whole has, however, been overtaken by an extremely challenging consumer, macro-economic and foreign exchange rate environment necessitating a change in business requirements. A complete refocus of the business on profitability and cash generation has triggered a major cost and capex review. As part of this process, management conducted an in-depth review of the costs to successfully complete and implement the remainder of the Tech Mod programme against the strategic, operational and financial needs of the group. As the time, costs and management focus to complete the remaining Tech Mod modules was deemed to be too high for the business to absorb in the current environment and, taking into account the functionality of the current technology and the incorporation of AI in the business, the group has opted to discontinue the programme.
This decision has resulted in the group booking an impairment charge of ZAR1.2bn in FY24 against the capitalised cost of this project (ZAR1.0bn net of tax and minorities), representing mainly by the cost of project architects, software developers, project managers, software testers and consultants over the project period. The project also has onerous contracts, against which the group has raised a provision of ZAR136m at year-end.
Nigeria non-quasi inter-group loan
The material depreciation of the NGN through the course of FY24 has resulted in an increase in foreign exchange translation losses on the non-quasi component of the USD-denominated inter-group loan between MultiChoice Africa Holdings B.V. and MultiChoice Nigeria Limited. These losses, which are non-cash in nature, amounted to ZAR4.6bn in the consolidated income statement (FY23: ZAR1.7bn).
Nigeria tax settlement
In February 2024, the group announced that it had reached a settlement with the Nigerian Federal Inland Revenue Service (FIRS) in relation to the tax assessments raised in April 2021 on MultiChoice Nigeria Limited (MCN) and in June 2021 on MultiChoice Africa Holdings BV (MAH). The parties (FIRS, MCN and MAH) concluded a ‘without prejudice or precedent’ agreement in full and final settlement of all matters in dispute. In terms of the agreement, MCN and MAH agreed to pay a total tax amount of NGN35.4bn (~USD37.3m), to be offset against the security deposits and good faith payments previously made.
Share transactions
During FY24, the group repurchased 5.3m shares in the market worth ZAR482m at an average share price of ~ZAR91 per share. These shares have been allocated to share incentive awards in the share trust and will not be cancelled by the group. At the end of March 2024, a total of 1.9m shares at an average price of ~ZAR116 per share remain unallocated for future use.
Subsequent events – Canal+ mandatory offer
The group entered into a Cooperation Agreement with Groupe Canal+ SA (Canal+) in relation to Canal+’s mandatory offer for the group. This followed a ruling by the Takeover Regulation Panel (TRP) of South Africa, which required Canal+ to pursue a mandatory offer after it acquired an interest of more than 35% in MultiChoice. In relation to the mandatory offer:
- Canal+ submitted an offer of ZAR125 per share in cash (an earlier non-binding intention to offer of ZAR105 was rejected)
- MultiChoice constituted an independent board of directors, which appointed The Standard Bank of South Africa Limited as an independent expert (IE) to review the terms of the offer and express a “fair and reasonable” opinion as required by the Takeover Regulations. The opinions are contained in the combined offer circular mentioned below.
- Following the posting of a Firm Intention Announcement (FIA) on 8 April 2024, the Combined Offer Circular was distributed on 4 June 2024. In the intervening period, Canal+ increased its shareholding in the group from 35.01% to 45.20%.
Dividend
In view of the group’s commitments under the Cooperation Agreement with Canal+, as published in the Combined Offer Circular on 4 June 2024, the question of a dividend declaration does not arise for FY24.
Appreciation
During an incredibly challenging year for the group, I would like to join Calvo in thanking the Board for their ongoing support and guidance and the group’s Executive Committee for their leadership and focused execution during FY24. I would also like to acknowledge the remarkable work done by the operations and finance teams in delivering well ahead of the group’s cost reduction targets and against our tactical decision to meaningfully reduce the group’s decoder subsidy spend. We in particular appreciate the ongoing support from our customers, suppliers and investors especially during adverse periods such as the one we have experienced through the year past.
Tim Jacobs
Group Chief Financial Officer
12 June 2024